

En
Track usage, watch connector health, drill into any customer, and reproduce any issue.
In real time, in one place.
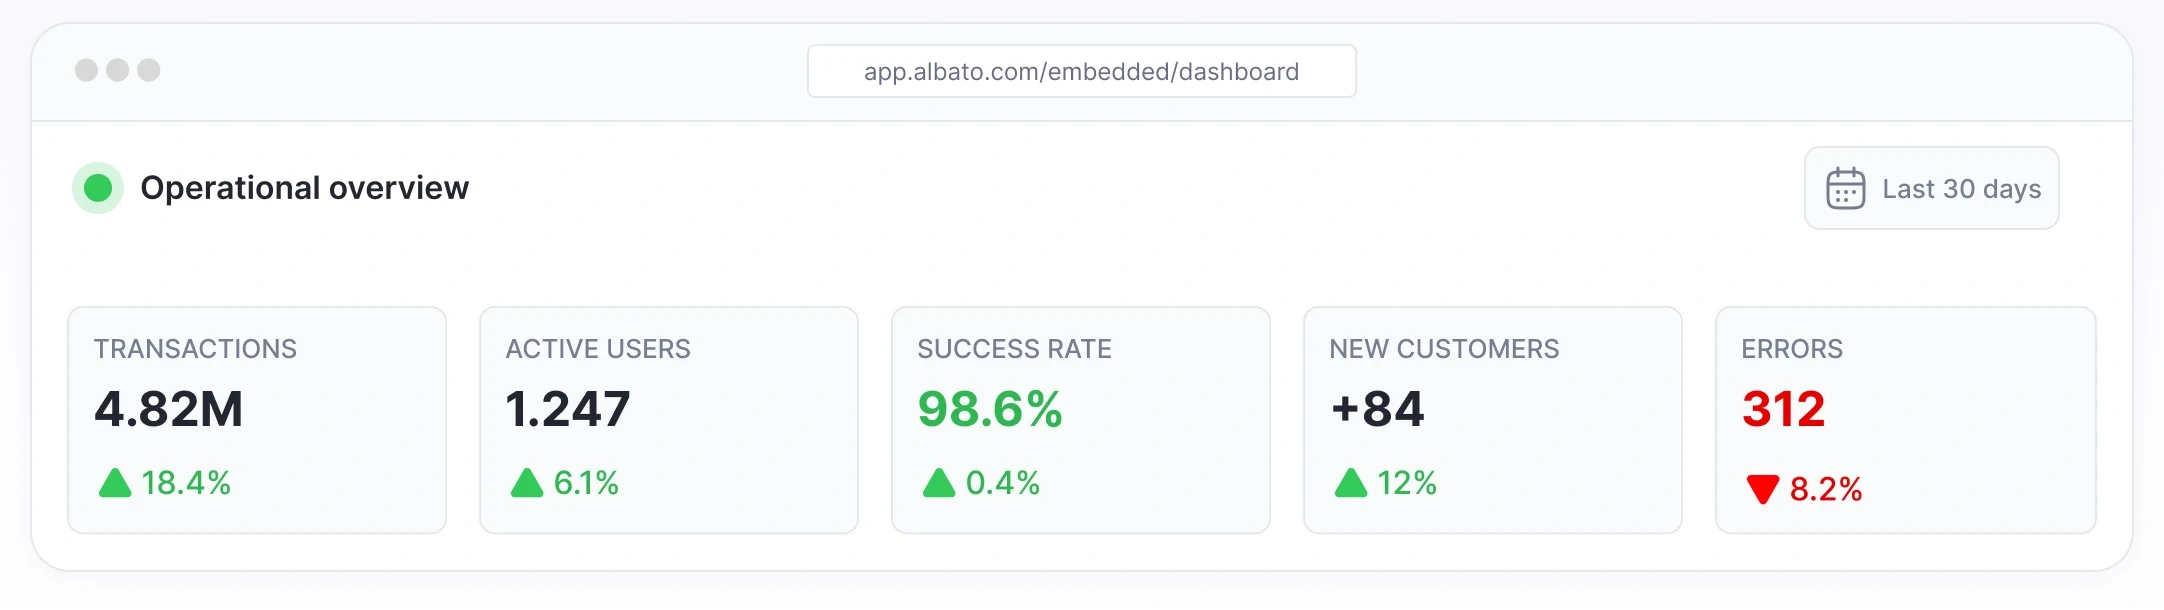
The dashboard opens on a 5-metric snapshot of how your embedded integrations are performing. Filter by 7 days, 30 days, current month, or any custom range.
Transactions
Successful automation operations
Active users
Customers who ran at least 1 automation in the period
Integration success rate
Ratio of successful runs to total runs
Customer trends
Registered users, new onboards, accounts generating transactions
Error trends
Growth, recurrence, distribution across connectors
Each report answers a different operational question. They share the same filters and date ranges. Most teams open 2 or 3 of them daily.
Consumption Analytics
Where your operational load actually comes from
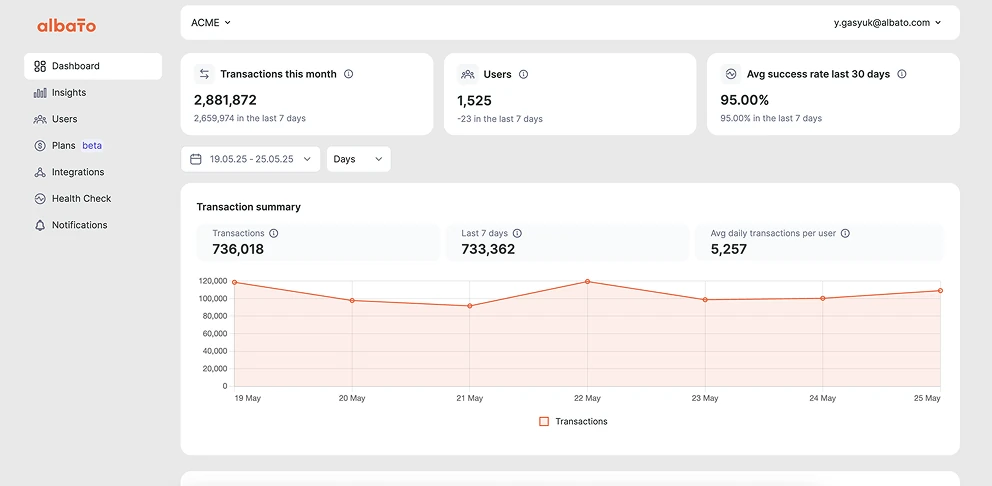
What you see
What it answers
Customer-Level Analytics
Per-customer behavior, in detail
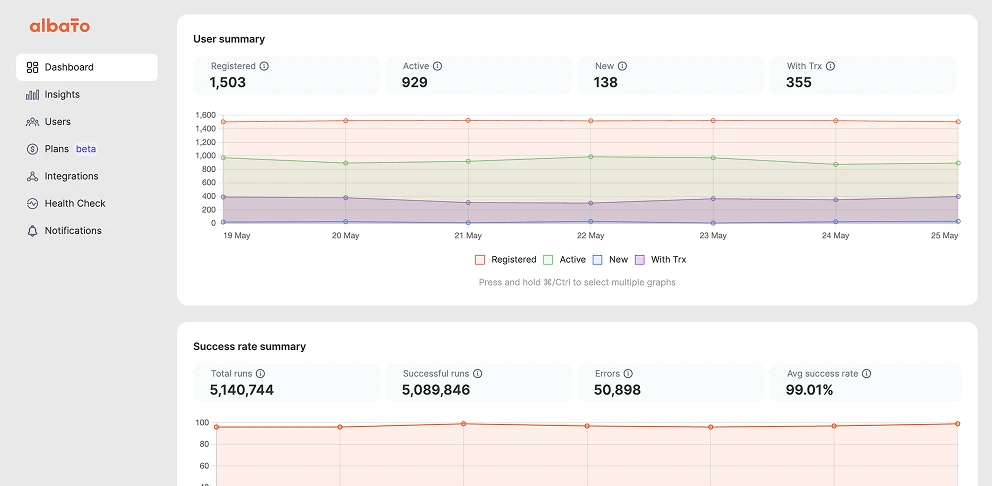
What you see
What it answers
Connector & App Usage
Which apps your customers actually use
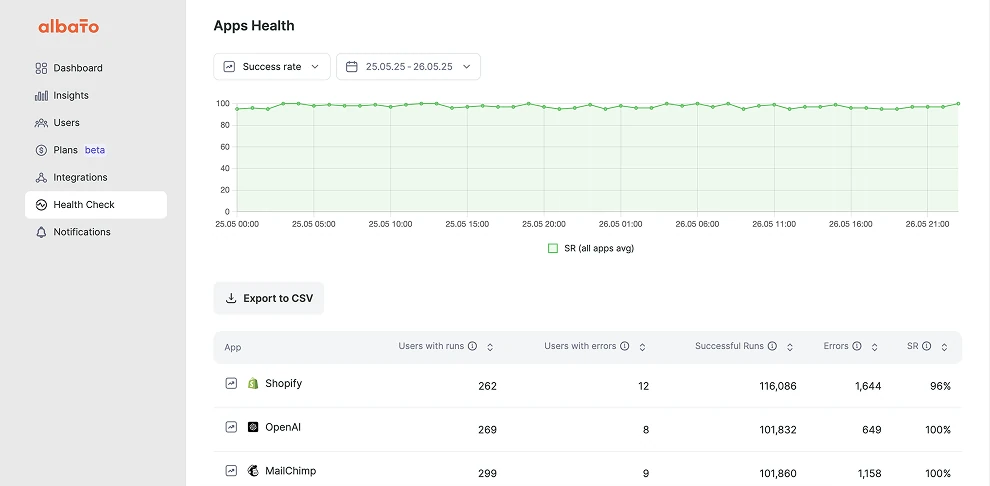
What you see
What it answers
Connector Health Monitoring
Real-time reliability across all 1,000+ connectors
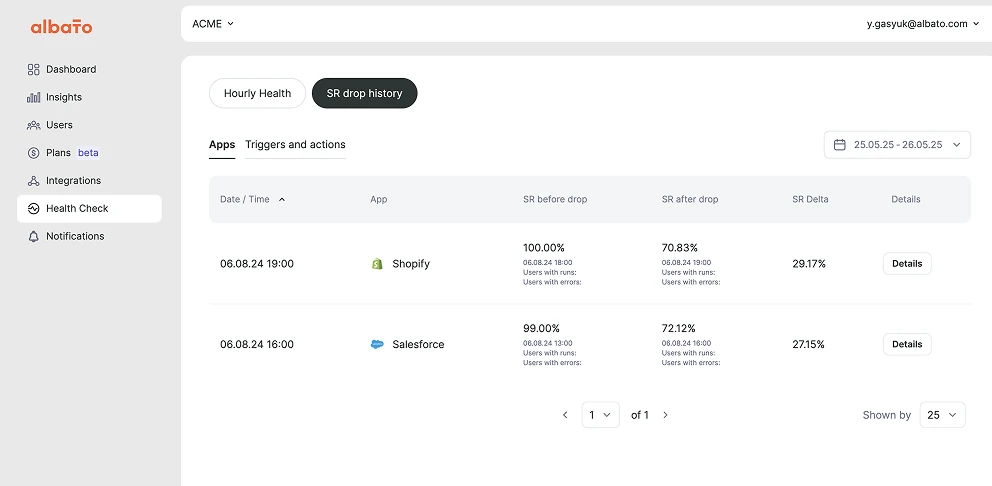
What you see
What it answers
Customer Environment View
A direct, audited look inside any customer's setup
What you see
What it answers
Reports are designed to be read inside the panel and operated on outside of it.
CSV Export
Nearly all analytics views export to CSV. Many teams build recurring exports into customer reviews, internal BI pipelines, and monetization tracking.
Alerts and Notifications
Configure alerts on transaction limits, connector degradation, automation failures, and customer-side errors.
Webhook Payloads
Webhook events include customer ID, automation ID, connector, and error details. Route them into your incident workflows or use them to power branded customer notifications on your side.
The reports connect to each other. You move from a high-level signal to a fix in 5 steps, all inside the panel.
1. Spot the signal
Example: connector health shows a drop. HubSpot success rate just moved from 96% to 82%.
2. Drill into the connector
Inside the connector report, see which action is failing.
3. Identify affected customers
Filter by customer to see exactly who is hit. Prioritize Enterprise and high-volume accounts first.
4. Open the customer's environment
Jump into the customer's automation builder. Inspect the failing run. Confirm the root cause in seconds.
5. Resolve and notify
Apply the fix in the customer's automation builder and fire a webhook to notify the affected accounts.